Summary and Schedule
In this section we will focus on the datasets being used in the lesson.
| Setup Instructions | Download files required for the lesson | |
| Duration: 00h 00m | 1. DataFrames - Part 1 |
What is a Dataframe, and how can we read data into one? What are the different methods for manipulating data in Dataframes? What makes data visualisation simple, in Python? |
| Duration: 02h 00m | 2. Data Frames - Part 2 |
What is bivariate or multivariate analysis? How are bivariate properties of data interpreted? How can a bivariate quantity be explained? When to use a correlation matrix? What are ways to study relationships in data? |
| Duration: 04h 00m | 3. Image Handling |
How to read and process images in Python? How is an image mask created? What are colour channels in images? How do you deal with big images? :::::::::::::::::::::::::::::::::::::::::::::::: |
| Duration: 06h 00m | 4. Time Series |
How is time series data visualised? Why is it necessary to filter the data? How do we study correlation among time series data points? |
| Duration: 08h 00m | Finish |
The actual schedule may vary slightly depending on the topics and exercises chosen by the instructor.
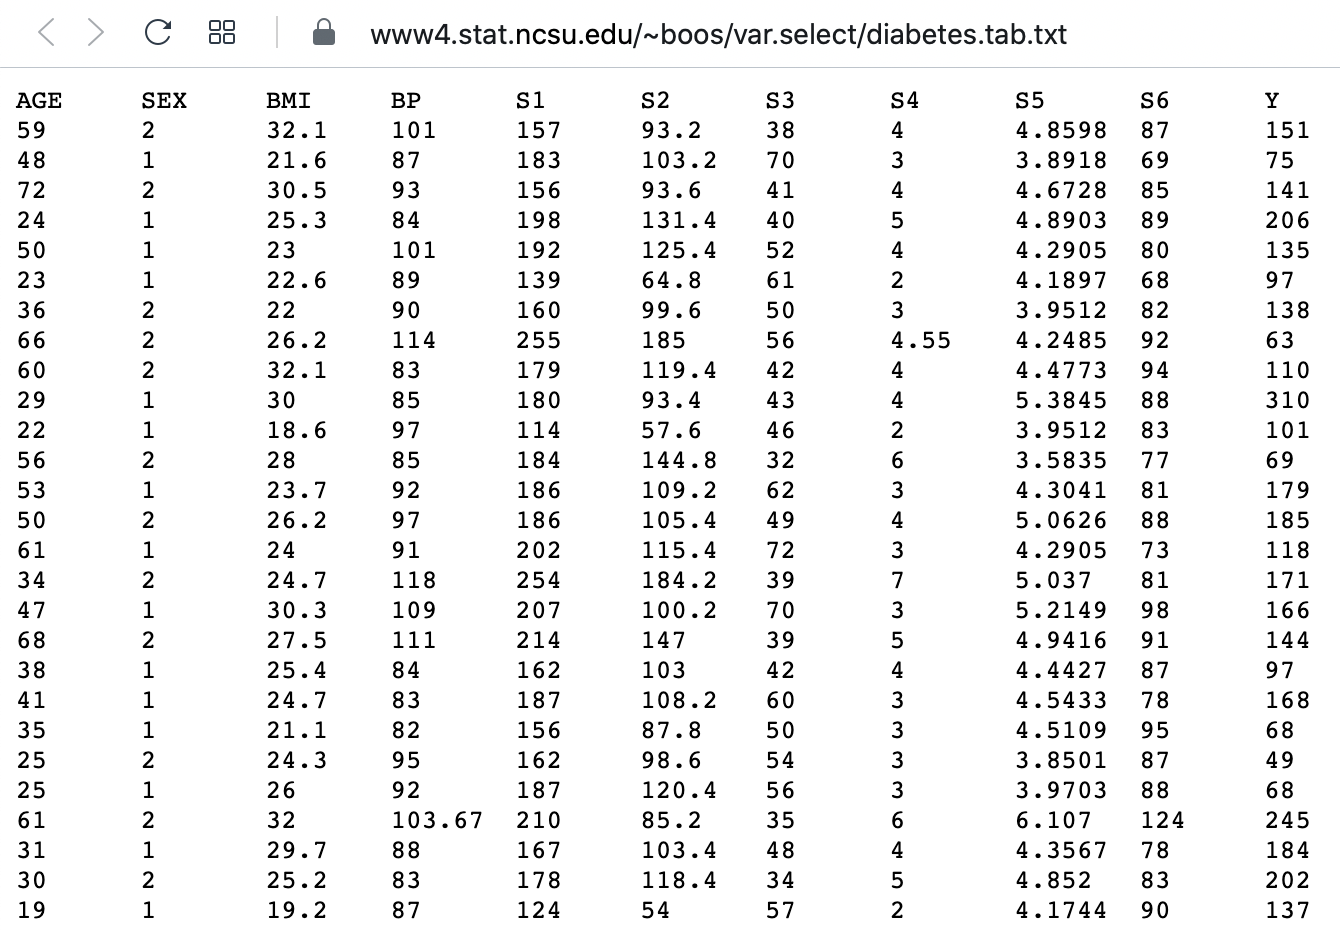
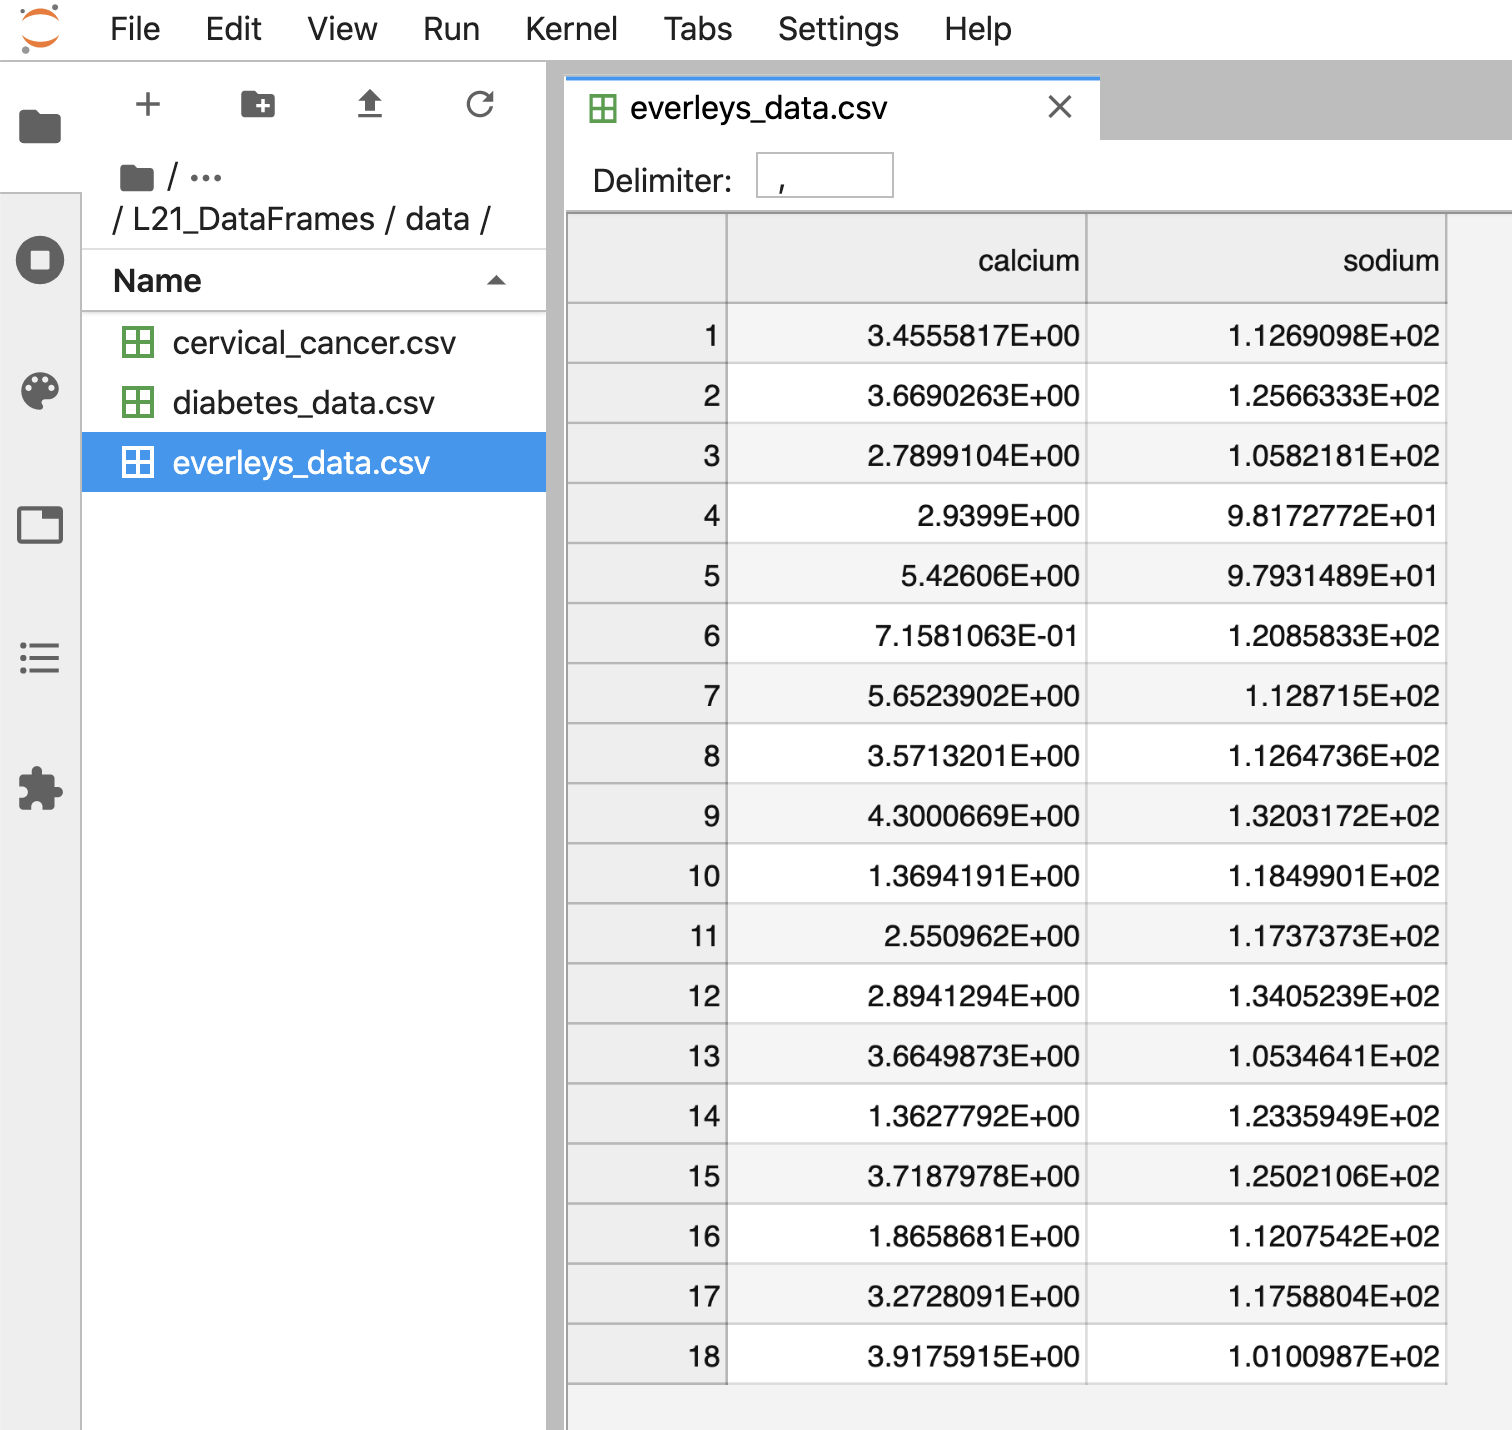
Data Sets - Data Frames
Please download the data zip file and unzip it to your Desktop. It contains:
The code assumes a path to the data files as ‘/data/…’ or ‘...’, respectively. Please create a subfolder called ‘data’ in your current directory and put the data files in it.
Please download the fig zip file and unzip it to your Desktop. It contains:
Data Sets - Image Handling
To include the figures in your notebook, please create a subfolder called ‘figs’ in your current directory and put the figure files in it. You can check the pdf of the notebook for reference.
Data Sets - Time Series
Please download the data zip file for topic time series and unzip it to the folder where your notebook is. It contains: